Performance Bar
A Performance Bar can be displayed, to dig into the performance of a page. When activated, it looks as follows:
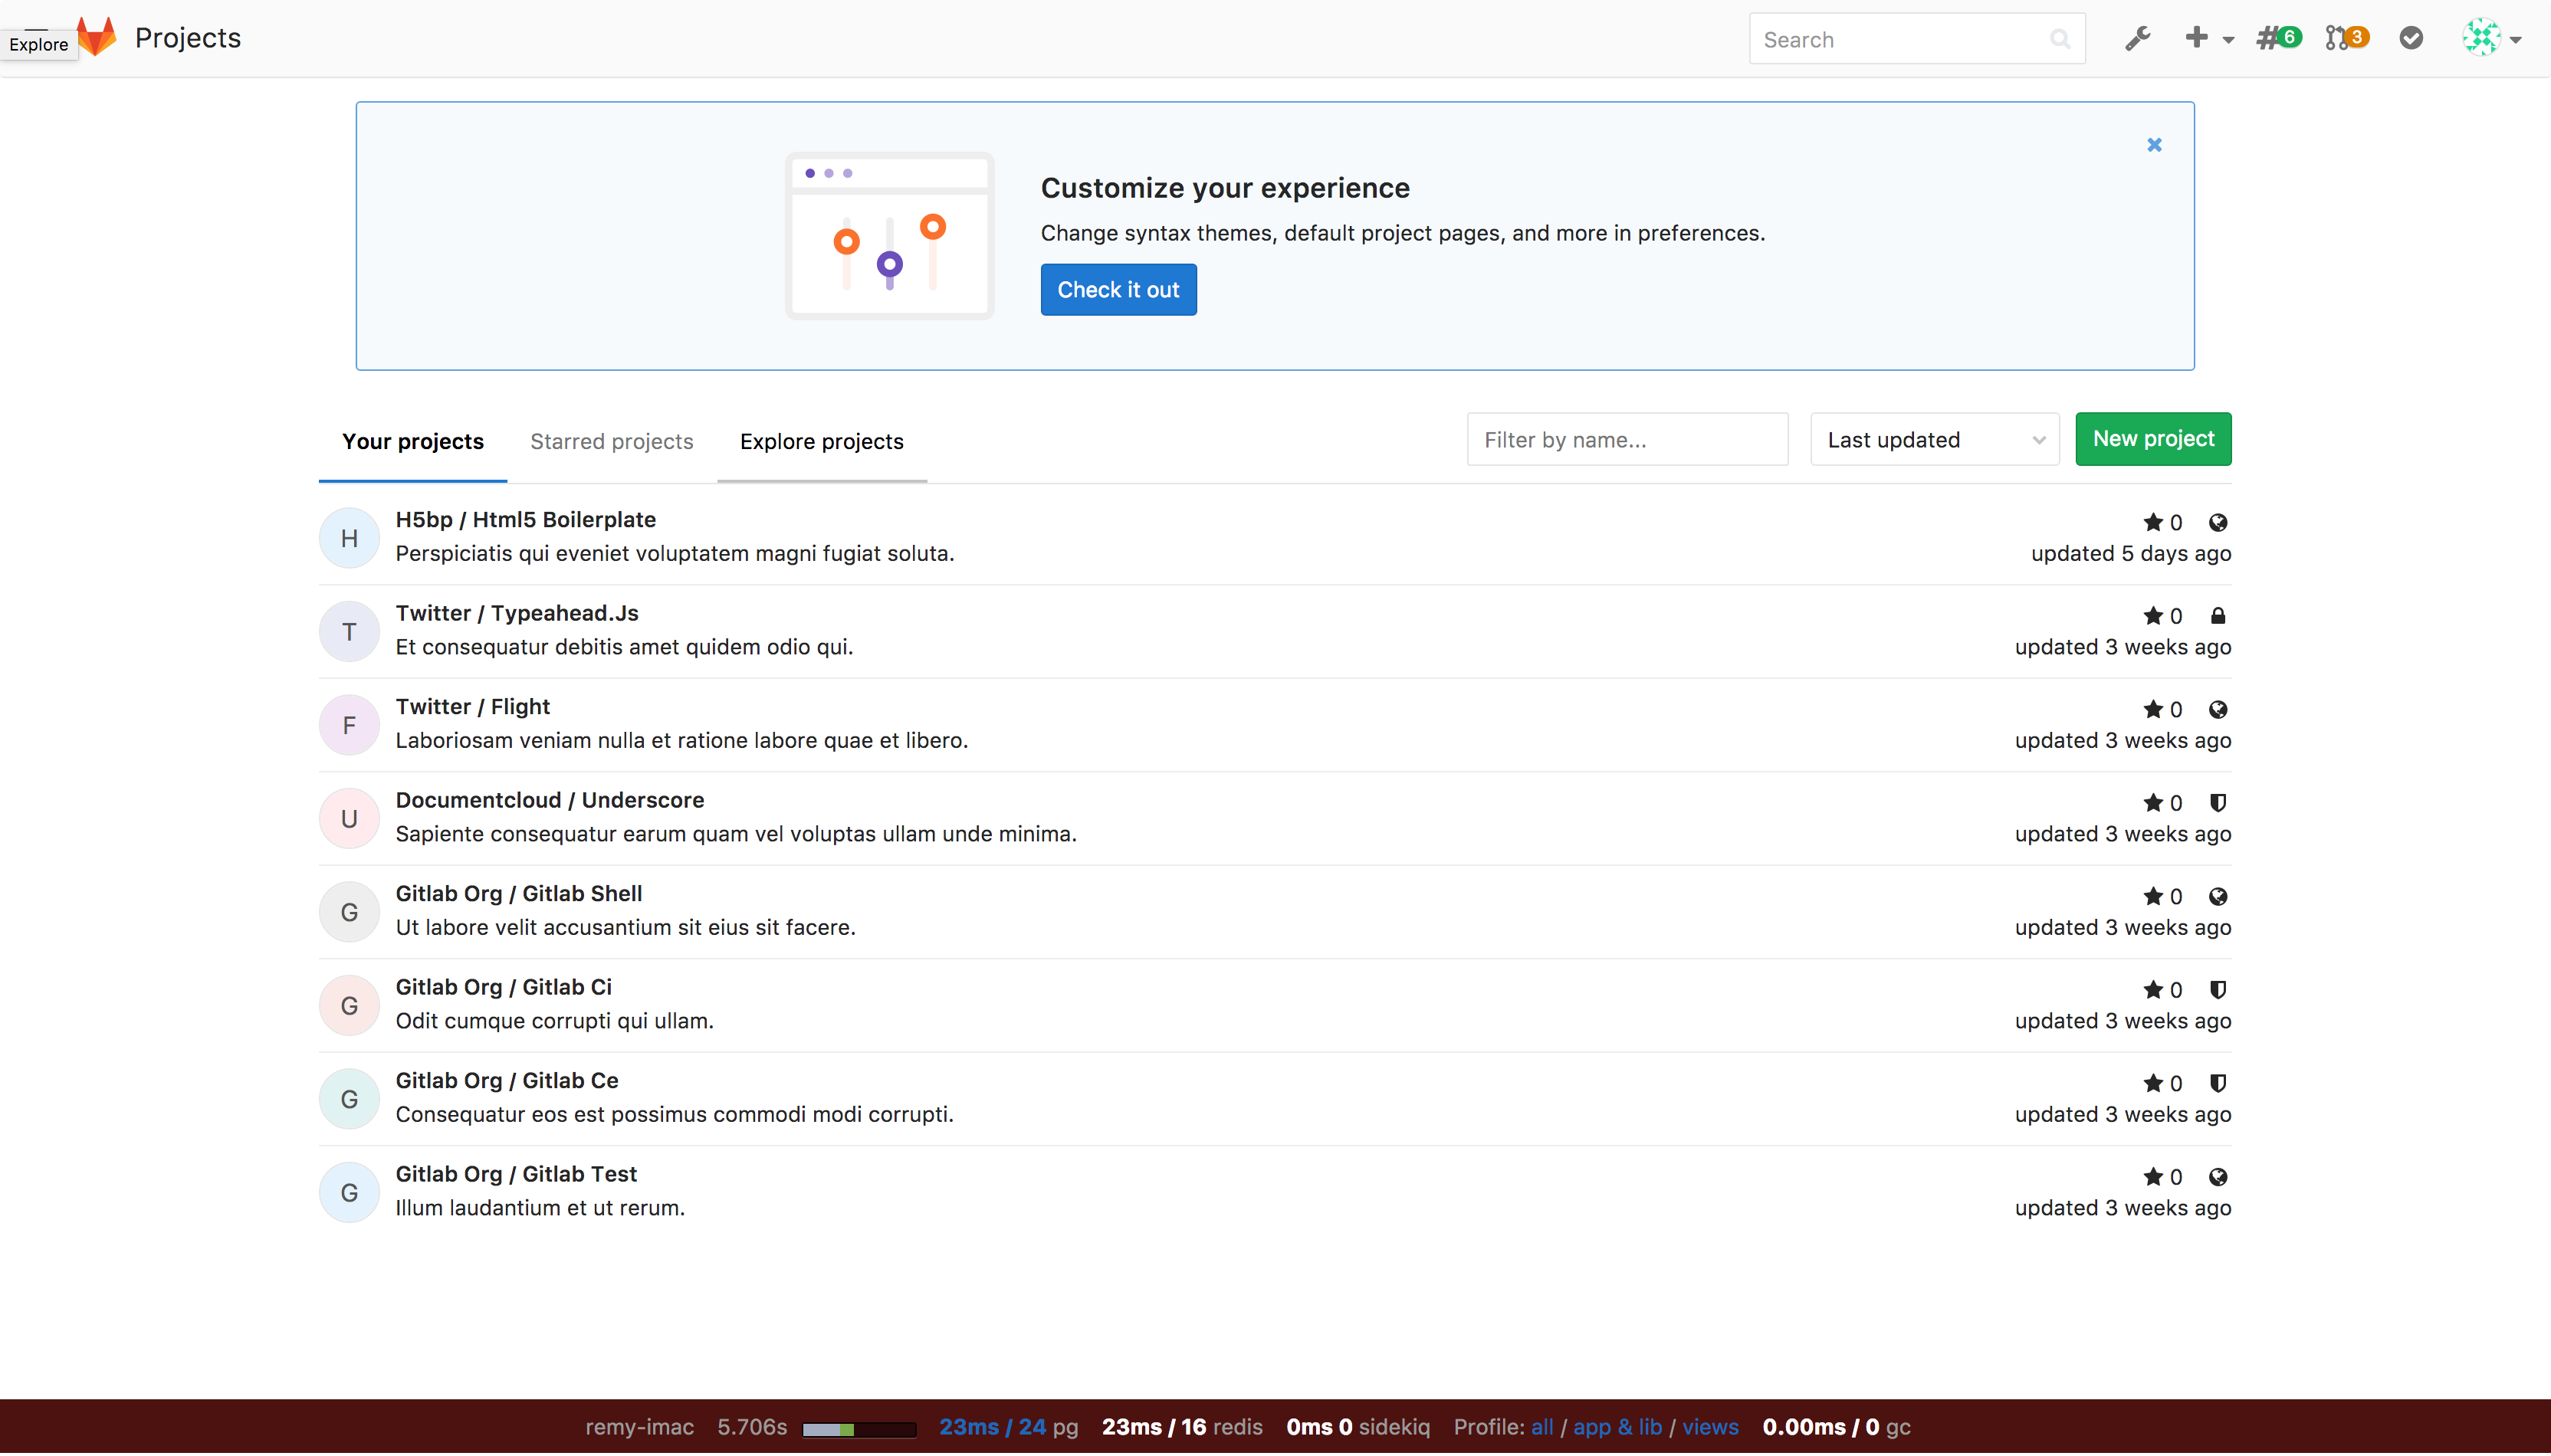
It allows you to:
- see the current host serving the page
- see the timing of the page (backend, frontend)
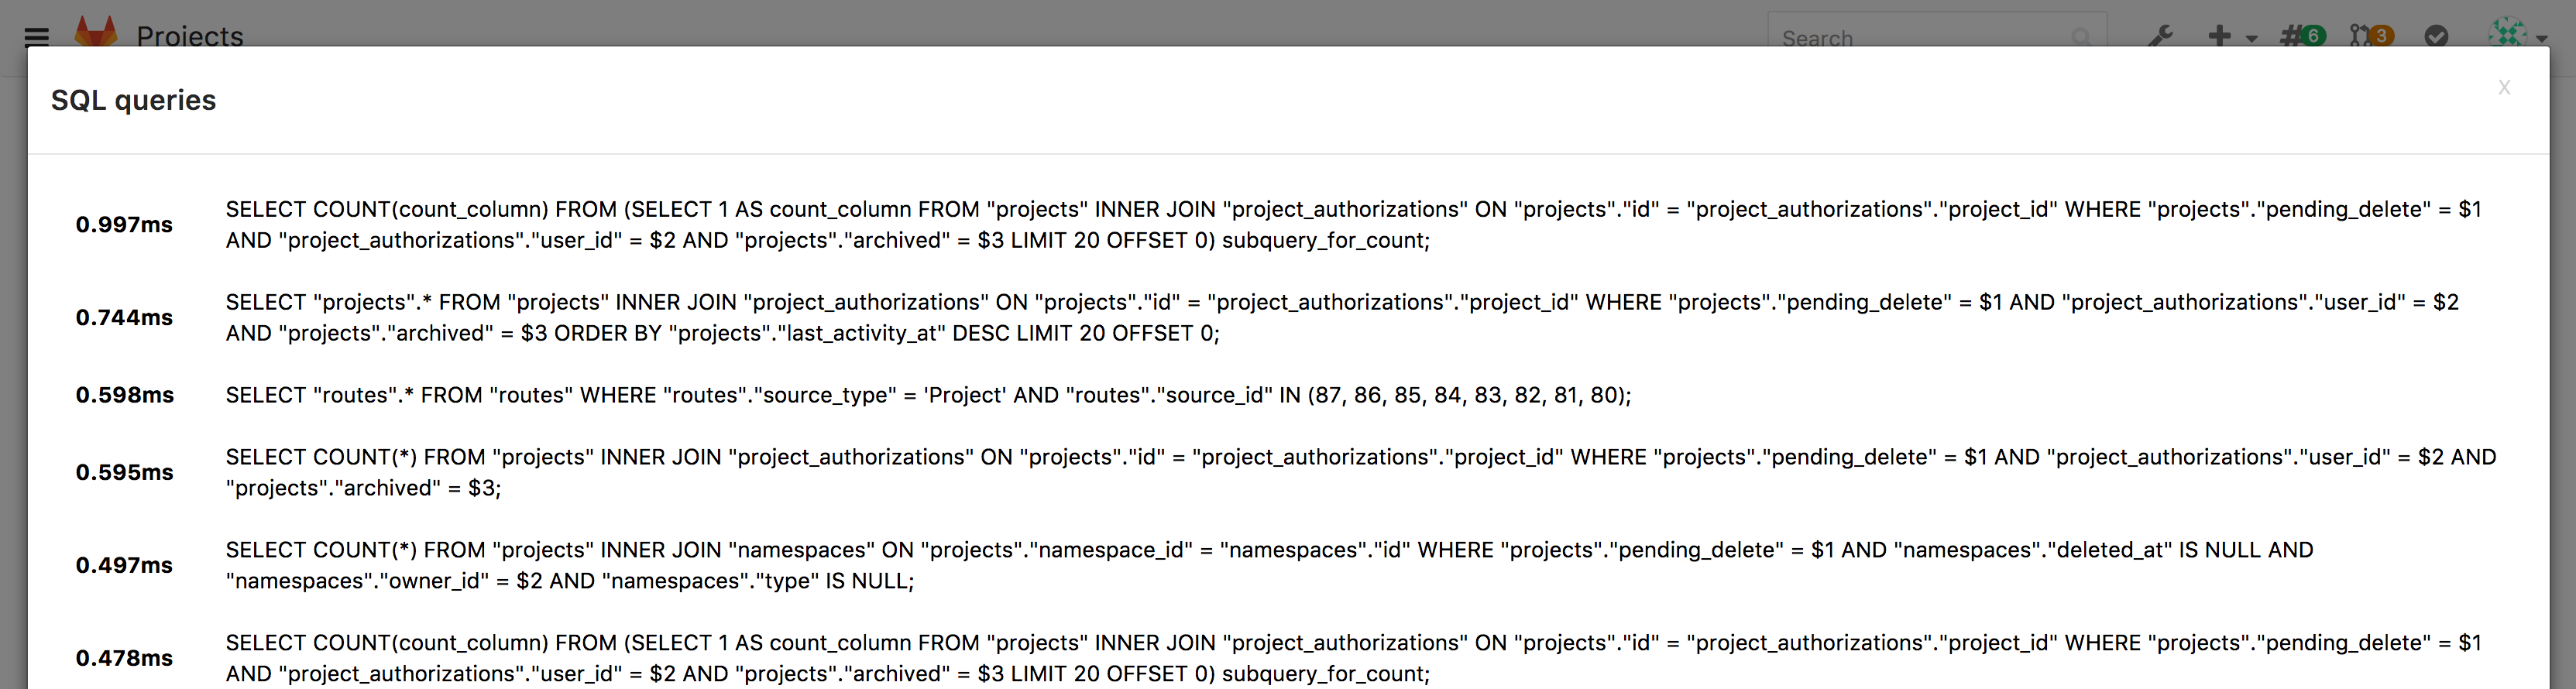
- the number of DB queries, the time it took, and the detail of these queries
- the number of calls to Redis, and the time it took
- the number of background jobs created by Sidekiq, and the time it took
- the number of Ruby GC calls, and the time it took
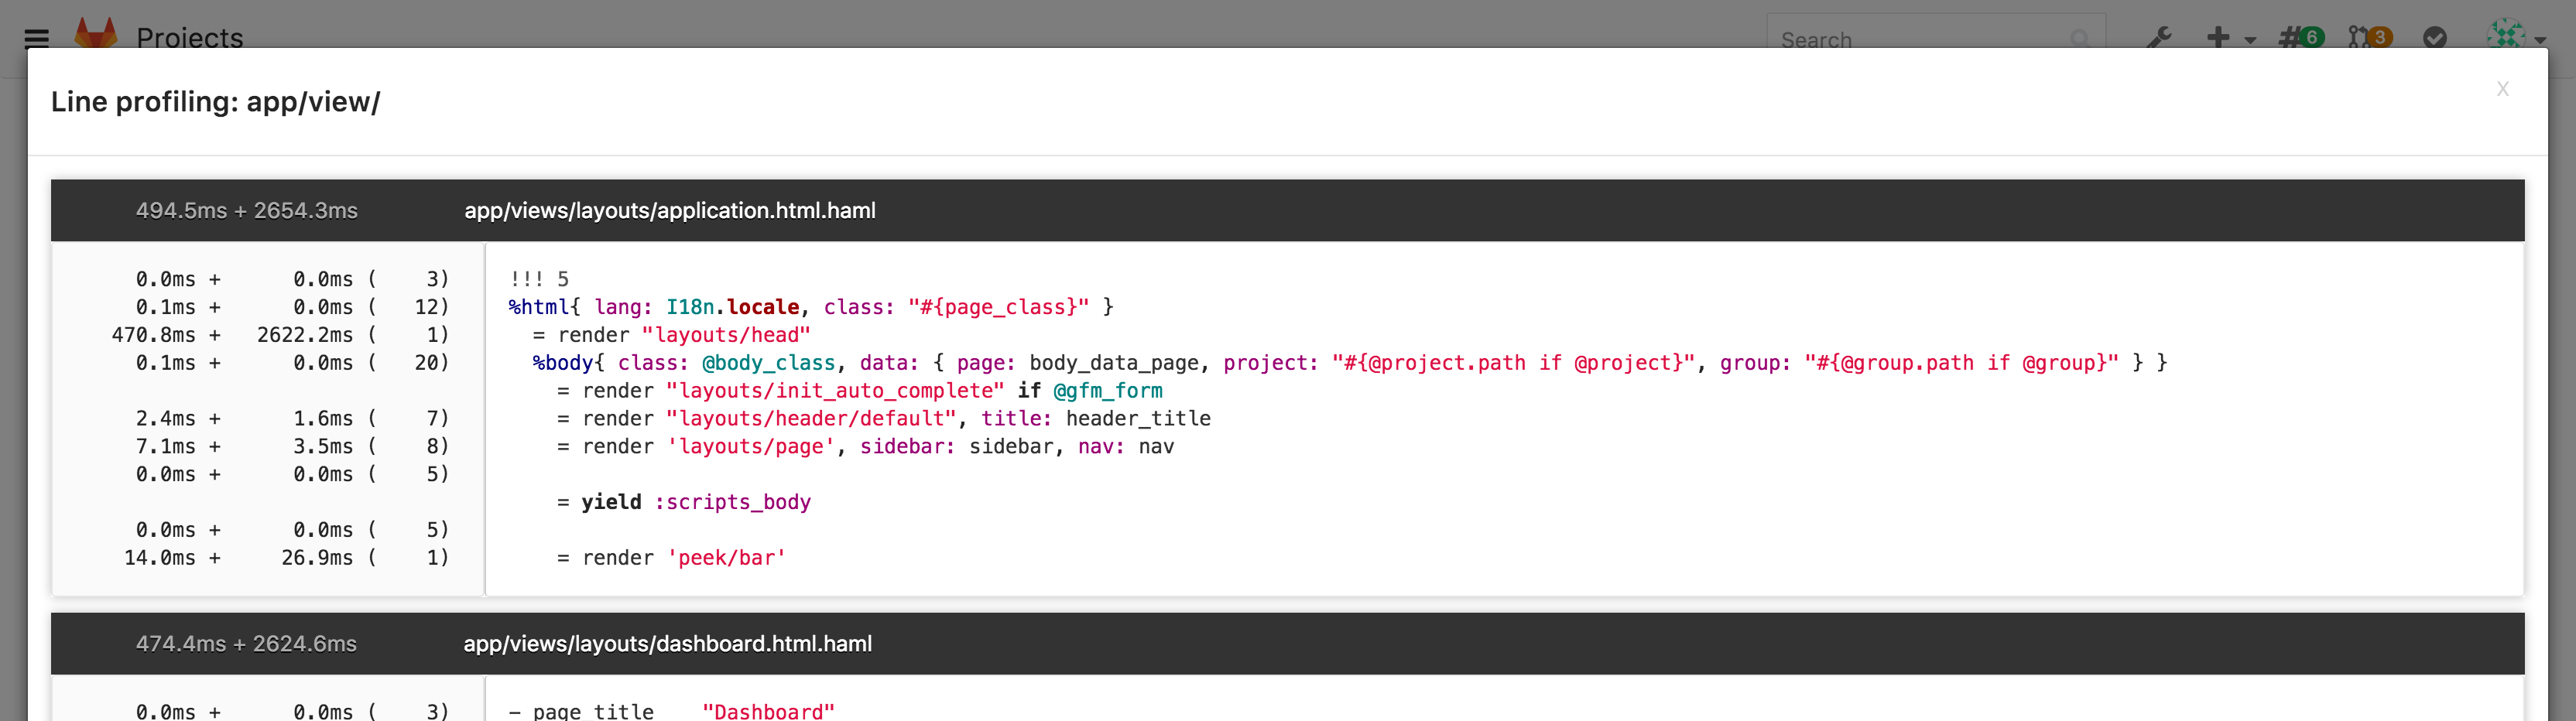
- profile the code used to generate the page, line by line
Enable the Performance Bar via the Admin panel
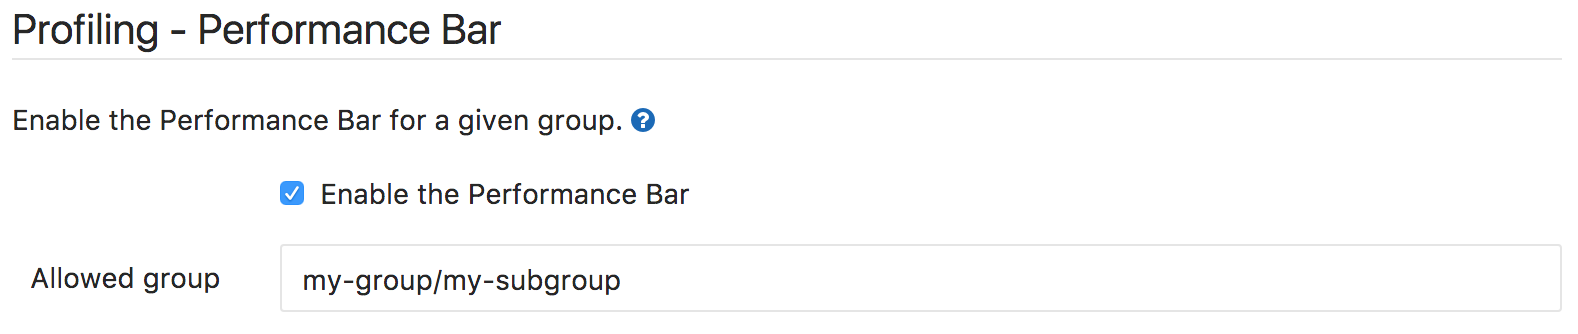
GitLab Performance Bar is disabled by default. To enable it for a given group,
navigate to the Admin area in Settings > Profiling - Performance Bar
(/admin/application_settings).
The only required setting you need to set is the full path of the group that will be allowed to display the Performance Bar. Make sure Enable the Performance Bar is checked and hit Save to save the changes.